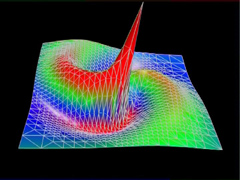
 This
video
visualizes a particle which travels around a
neutron star on a hyperbolic path. The particle excites
the star to oscillations by gravitational interaction
and to coupled emission of gravitational waves.
The underlying computation is based on a multipole expansion
of the particle.
Each multipole generates its own oscillation.
Summing over all multipoles yields the overall oscillation pattern.
The perturbation of the metric can be decomposed into
two terms. The first term is a conformal factor.
The second term describes the deviation from the conformally flat metric.
The data is visualized by using both a height field and color coding, as presented in Chapter 12. Only the difference of the true metric and the underlying metric of the neutron star is visualized, i.e., only the perturbation of the spacetime induced by the particle. The quality of the triangle mesh representing the height field is increased by adaptive refinement, as opposed to regular sampling.
The first part of the film shows the time evolution of the conformal factor (metric component "t") in the x-y plane. The first sequence specifically visualizes the triangulation by marking the triangle edges with a wireframe. The second sequence shows the surfaces by smooth shading. In both sequences, the particle travels in the x-y plane. In the beginning, the gravitational field of the particle is visible. The particle is smeared out because only ten orders of the multipole expansion are taken into account. The neutron star itself is located at the midpoint of the plane. When the particle is approaching the neutron star, emission of gravitational waves is induced. These waves are superimposed onto the gravitational field of the particle. The neutron star keeps oscillating and emitting characteristic gravitational waves, mainly consisting of f-mode and some p-modes, after the particle left the neutron star.
The second part of the film shows the time evolution of the second term (metric component "s"). Again, both wireframe rendering and smooth shading are included. The spiral emission of gravitational waves, while the particle is orbiting the neutron star, and the subsequent oscillations of the neutron star are most prominent.
Length: 1:51 min